An OERC Resolution Realized
Posted by nnlmneo on January 1st, 2016
Posted in: Blog

Happy New Year, readers. We decided to start 2016 on a high note with the OERC Blog’s Annual Report.
Wait, don’t leave!
I promise, there’s something for everyone at the end of this post. There are links to the most popular evaluation tools and resources from our blog entries this year. We judged popularity using our “clickthrough” statistics, showing the links that were most likely to be clicked by our readers to further investigate the resources featured in our blog posts.
(If you want, you can skip to the bottom now. We’ll never know.)
But first, we are going to take a moment to describe how far our blog has come since its inception in 2006. That’s right, August 2016 is the 10-year anniversary of the OERC blog. I’ve been a contributing blogger for almost a decade. Karen, the newcomer, started contributing in February 2015, the month she joined the OERC. Her entries are quite popular: Most of the top 10 clickthroughs below were presented in Karen’s posts.
For most of the blog’s history, OERC staff posted 12-16 times per year (about 1 per month). However, in January 2014, the OERC staff committed to increasing our blog activity. That year, we managed a little better than three posts per month. This year, we finally met our goal of once-per-week posts. We had 52 entries between January 1 and December 31, 2015.
Of course, writing blog posts is one thing. Writing blog posts that people read is another. Our first indication that our blog was gaining readership was through the OERC’s appreciative inquiry interviews conducted in late 2014. (See our blog post on October 31, 2014 for a description of this project) Many of the interviewees mentioned the blog as one of their favorite OERC services.
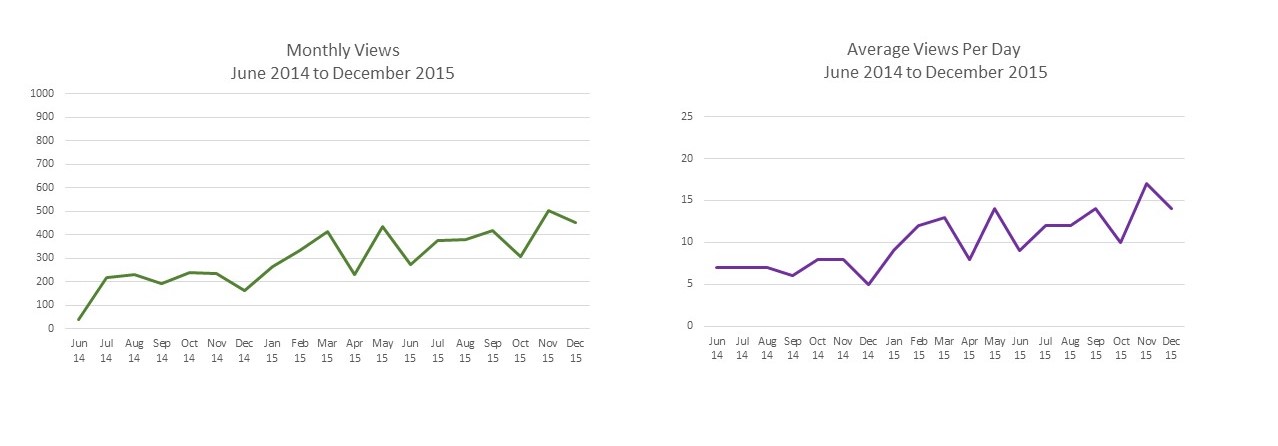
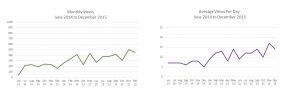
Now, we have quantitative evidence of a growing readership: our end-of-year site statistics. Our stats only go back to June 2014. Even with that limited timeline, you can see substantial growth. Our peak month in 2014 had 241 total views. In 2015, our peak month had more than double the traffic, with 508 views. In 2014, we had an average of 7 views per day. In 2015, our average was 12 views per day.
So thank you, readers. You are behind those numbers. In the coming year, we resolve to continue our weekly posts on a variety of evaluation topics.
And now, as promised, here are the top 10 “clickthrough” URLS from last year. If you missed any of the trending evaluation resources from our blog, here’s your chance to catch up.
Note: OERC link updated 9/21/2017.
 ABOUT nnlmneo
Email author
View all posts by nnlmneo
ABOUT nnlmneo
Email author
View all posts by nnlmneo
 Visit us on Facebook