#Eval17 Highlights
Posted by nnlmneo on November 13th, 2017
Posted in: Blog, Data Visualization
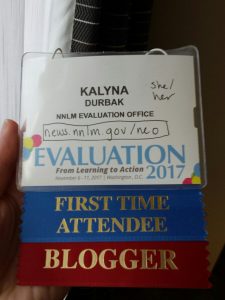
The whole NEO team attended AEA’s Evaluation 2017 conference last week. I am still processing a lot of what I’ve learned from the conference, and hope to write in more detail about them in the upcoming months. Until then, here are some of my highlights:
Workshops
I attended the two-day Eval 101 workshop by Donna Mertens, and the half day Logic Model workshop from Thomas Chapel. Both workshops gave me a solid understanding of how evaluators plan, design, and execute their evaluations through hands-on training. I know I’ll be referring to my notes and handouts from these workshops often.
Ignite presentations
The conference website defines these presentations as “20 PowerPoint slides that automatically advance every 15 seconds for a total presentation time of just 5 minutes.” Just thinking about creating such a presentation makes me nervous! The few that I saw have inspired me to work on my elevator pitch skills.
#Eval17Twitter
I attended a delicious lunch with fellow evaluators who are active on Twitter. Though I am not very active on that platform, they welcomed me and even listened to my elevator speech about why public libraries are amazing. Each attendee worked in different evaluation environments, and came from all over the United States and around the world. It was a fun way to learn more about the evaluation field.
Sessions
It’s hard to pick a favorite session, but one that stood out was DVR3: No title given. Despite the lack of a title, the multipaper presentation will stay with me for a long time. The first presentation was from Jennifer R. Lyons and Mary O’Brien McAdaragh, who talked about a personal project sending hand-drawn data visualizations on postcards. The second presentation, by Jessica Deslauriers and Courtney Vengrin, shared their experiences using Inkscape in creating data visualizations.
First NEO meeting IRL
This is my favorite part of the conference. I’ve been working with the NEO for over a year, and yet this was the first time we were all in the same room together. It was such a treat to dine with Cindy and Karen, and work in the same time zone. We also welcomed our newest member, Susan Wolfe, to the team. Look for a group photo in our upcoming Thanksgiving post.
I recommend librarians interested in honing their evaluation skills to sign up for the pre-conference workshops, and to attend AEA’s annual conference at least once. It opened my eyes to all sorts of possibilities in our efforts to evaluate our own trainings and programs.
 ABOUT nnlmneo
Email author
View all posts by nnlmneo
ABOUT nnlmneo
Email author
View all posts by nnlmneo
 Visit us on Facebook
