Jun
19

Posted by Sarah Levin-Lederer on June 19th, 2023
Posted in: Blog
Tags: evaluation, Focused Outreach, process evaluation, rural health
Every year, R7 takes a closer look at two geographic areas within our service area as a way to learn more about the needs of the communities and to strengthen and build relationships through the process of Focused Outreach. During the 2021-2026 funding cycle, we’re committed to learning more about the rural communities that make up our R7 and also create and implement new outcome and process evaluation procedures.
Focused Outreach has been part of R7 and previously NER’s model of service for 10+ years, but between the COVID pandemic and changes to our service area by adding New York, it was time to redo and recommit to an evaluation plan including better analysis of qualitative data from key informant interviews and standardizing contact tracking for process evaluation.

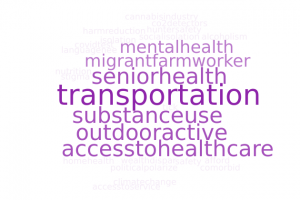
Berkshire County answers to “Based on your experience with the community, what are the primary health concerns?”
Two years into the 2021-2026 funding cycle, we’re seeing patterns including the ways that rural looks different in different parts of the region. Although all rural areas have reported access and transportation issues, communities in Upstate NY, Northern VT, Maine, and Northern NH often have to travel further for services than communities in southern New England–3+ hours vs. 1-2 hours. Also, for communities that rely on seasonal tourism, some resources and services may be more available during tourist season, but that same tourism may also be pricing out year-round residents.
Key informants, when asked about the health needs of their communities and accessing health information online, often mention social determinants of health instead of mentioning specific health conditions or topics.
THEMES:

Northern VT answers to “Based on your experience with the community, what are the primary health concerns?”
Over the last two years, we’ve also seen some emerging overarching health topics come up frequently in interviews.
HEALTH TOPICS:
Long Term Partner Engagement:
We’re also tracking ongoing partner engagement with YR1 partners.
Essex and Hamilton Counties, NY:
Aroostook County, ME:
Keeping consistent tracking sheets that show who we’ve reached out to, who has engaged in the process and more has allowed us to start to answer questions like:
How many organizations do we contact to get one interview?
What’s the average time from initial contact and interview?
Given the low interview rate–14 total interviews across both areas, more data is needed to see how consistent these numbers are and to see what might affect the willingness of contacts to participate and how long it takes to set up an interview.
In YR3, we’ll be working to standardize how we capture data and working on best practices for qualitative data analysis, including key word standardization and data entry.
We’ll be in Sullivan and Cheshire Counties, NH and Litchfield County, CT this year. If you’re in those areas and interested in participating, let us know.