Mar
27

Posted by nnlmneo on March 27th, 2015
Posted in: Blog
 The OERC is excited to get the word out about the Center for Disease Control and Prevention (CDC)’s newly updated and redesigned Community Health Status Indicators (CHSI). The new CHSI 2015 represents the collaboration of public health partners in the public, non-profit and research communities, including the National Library of Medicine.
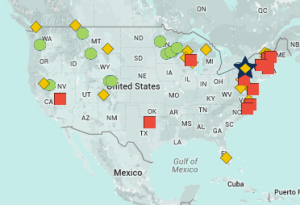
The OERC recommends the CHSI as a possible resource in the data gathering portion of planning outreach projects or needs assessments. CHSI 2015 is an interactive online tool that produces health profiles for all 3,143 counties in the United States. Each profile includes key indicators of health outcomes that describe the population health status of a county. What makes CHSI 2015 an important tool is that it includes comparisons to “peer counties” – groups of counties that are similar to each other based on 19 variables, including population size, percent high school graduates and household income.
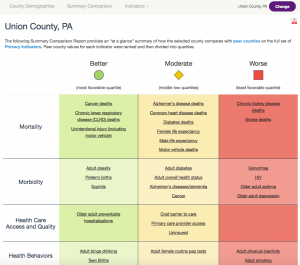
 For each county, CHSI 2015 provides a Summary Comparison Report. Using Karen Vargas’ childhood home of Union County, PA as an example, this report (right) shows that in the case of the overall cancer death rate, Union County does better than most of its peer counties. But in the case of stroke death rate, they do worse.
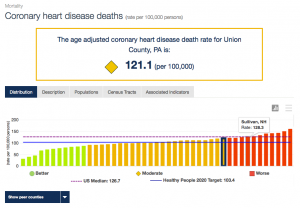
 By selecting a specific indicator, such as coronary heart disease death rate, the interactive CHSI 2015 will produce a bar chart showing Union County in comparison to its peer counties, as well as the US median and the Healthy People 2020 target (left).
More detailed, downloadable data for each peer county can also be found (below), as well as a web page detailing the sources of the data for each indicator. CHSI 2015 provides a helpful How to use CHSI web page that explains each feature and provides helpful hints.
CHSI 2015 is designed to complement other available sources of community health indicators including the Robert Wood Johnson Foundation’s County Health Rankings and Roadmaps.