The Accidental Objective
Posted by nnlmneo on June 10th, 2016
Posted in: Blog
A couple of months ago, I accidentally set an objective for the NEO Shop Talk blog.
First, let me give you my definition of an objective. I think of objectives as observable outcomes. An outcome defines the effect you want to make through a project or initiative. (You can read more about outcomes here.) Then, you add a measure (something observable), a target (what amount of change constitutes success), and a timeframe for achieving that target. For example, say your doctor tells you to lower your blood pressure. She likely will suggest you make some lifestyle changes, then return in six months (timeframe) so she can take a BP reading (measure) to see if it’s below 120/80, the commonly accepted target for “normal” blood pressure.
In February 2015, Karen and I had set an outcome to increase our blog readership. We monitored our site statistics, which we considered a measure of readership. However, we never wrote an objective or set a target. Like most of the world, we only write objectives when a VIP (such as an administrator or funder) insists. Otherwise, we are as uncommitted as the next person.
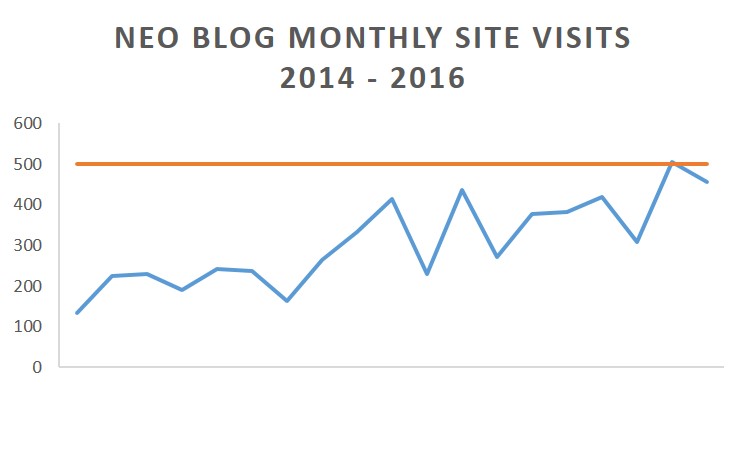
But then this happened. I was preparing slides for a webinar on data visualization design principles and wanted to show how a benchmark line improves the meaning of data displayed in a line graph. A benchmark line basically represents your target and allows readers to compare actual performance against that target. The best “real” data I had for creating a nice line graph was our blog’s site statistics. But I needed a target to create the benchmark line.
So I made one up: 500 views per month by March 1. I did check our historical site statistics to see what looked reasonable. However, I mostly choose 500 because it was a nice, simple number to use during a presentation. I didn’t even consult Karen. She learned about it when she reviewed my webinar slides.
After all, it was a “pretend” objective.
But a funny thing happened. As luck would have it, the NEO had nine presentations scheduled for the month of February, the month after I prepared the graph. Our new target motivated us to promote our blog in every webinar. By the end of February, we exceeded our goal, with 892 site visits.
It was game on! We started monitoring our site statistics the way cats watch a gecko. Whenever we feared we might not squeak across that monthly target line, we began strategizing about how to bump up readership. At first, we focused on promotion. We worked on building our following in Twitter, where we promoted our blog posts each week. Karen created a Facebook page so we had another social media outlet to promote our blog.
Eventually, though, we shifted our focus toward strategies for creating better content. Here were some of our ideas:
- Show our readers how to apply evaluation in their work settings. Most of our readers are librarians, so we make a point of using examples in our articles that demonstrate how evaluation is used in library programs.
- Demonstrate how the NEO evaluates its own program. We do posts about our own evaluation activities so that we can model the techniques we write and teach about.
- Allow our readers to learn about assessment from each other. We work for a national network and our readers like to read about and learn from their colleagues. We now seek interviews with readers who have evaluation success stories to share.
- Supplement our trainings. We create blog posts to supplement our training sessions. We then list relevant blog posts (with links) in our workshop and webinar resource lists.
- Improve our consulting services. We offer evaluation consultations to members of the National Network of Libraries of Medicine. We now send them URLs to blog posts that we think will help them with particular projects.
- Introduce new evaluation trends and tools: Both Karen and I participate in the American Evaluation Association, which has many creative practitioners who are always introducing new approaches to evaluation. We use NEO Shop Talk to pass along innovations and methods to our readers.
In the end, this accidental objective has improved our service. It nudged us toward thinking of our blog contributes to the mission of the NEO and the NN/LM.
So I challenge you to set some secret objectives, telling only those who are helping you achieve that target. See if it changes how you work.
If it does, email us. We’ll write about you in our blog.
By the way, if you want to learn how to add a benchmark line to your graphs, check out this post from Evergreen Data.
 ABOUT nnlmneo
Email author
View all posts by nnlmneo
ABOUT nnlmneo
Email author
View all posts by nnlmneo
 Visit us on Facebook