Mean, Median or Mode–What’s the Difference?
Posted by nnlmneo on November 7th, 2016
Posted in: Blog

Last week I taught the class Finding Information in Numbers and Words: Data Analysis for Program Evaluation at the SCC/MLA Annual Meeting in Galveston, TX. There is a section of the class where we review some math concepts that are frequently used in evaluation, and the discussion of mean, median and mode was more interesting than I expected. Mean, median and mode are measures of “central tendency,” which is the most representative score in a distribution of scores. Central tendency is a descriptive statistic, because it is one way to describe a distribution of scores. Since everyone there had run across those concepts before, I asked the group if anyone knew of any clever mnemonics for remembering the difference. Several people responded, both in class and afterwards (thanks Margaret Vugrin, Julia Crawford and Michelle Malizia!) Here are a couple of memory tools for you:
Mean: Turns out those mean kids are just average (mean = average)
Median: Just like the median in the road: if you line the values up in order, the median is the number “in the middle”
Mode: Mode has an “O” sound, and O is the first letter in “Often.” It is the value on the list which occurs most often.
Or
Hey diddle diddle, the Median’s the middle; you add and divide for the Mean. The Mode is the one that appears the most, and the Range is the difference between.
Now that you can remember them, which one should you use? I think a good way to think about it relates to the ratings you see when you’re trying to pick a hotel or restaurant. I don’t know about you, but when I’m looking at a restaurant score, when I see 4 stars (out of 5), I’m not comfortable with that number without seeing the breakdown. There’s a big difference between a 4 where the scores are spread out and one where the scores are heavily skewed towards 5.
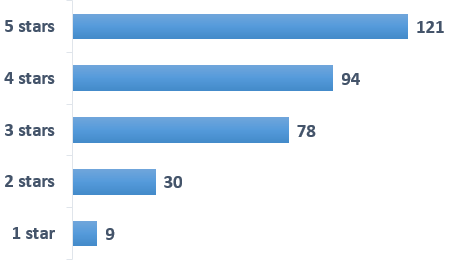
Let’s say I’m looking at reviews for hotdog restaurants that have around 4.0 stars. The first one I look at has a distribution of scores spread out relatively evenly from 5 stars (the most number of ratings) to 1 star (the fewest). A mean (mean kids are just average) works well here. To do this you add all the scores up and divide the sum by the number of responses to reach a mean of 3.9.
Here is the chart for a similar hotdog restaurant with a slightly higher 4.2 star rating:
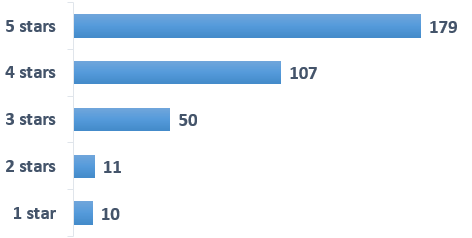
While the mean adds up to 4.2, you can see in the chart that the scores are heavily skewed towards 4 and 5 stars, and it seems that 4.2 does not accurately describe the ratings of that restaurant (remember that central tendency is a descriptive statistic). However, if you use a (middle of the road) median with this kind of distribution, the result is a whopping 5. To determine the median, you line all the results up in order and select the one in the very middle. You might want to use a median when the distribution looks skewed.
This particular restaurant analogy doesn’t really work with mode. Mode is used for categories, which really cannot be averaged mathematically. For example, if you want to know what is the most representative type of restaurant in your city, you might find out that your city has more hotdog restaurants than any other kind of restaurant (that would be awesome, right?).
I hope this helps. If you know any other mnemonics for mean, median, or mode, please send me an email at kjvargas@uw.edu and I will add them to the bottom of this post.
 ABOUT nnlmneo
Email author
View all posts by nnlmneo
ABOUT nnlmneo
Email author
View all posts by nnlmneo
 Visit us on Facebook