A Diagram is Worth a Thousand Words: Visual Evaluation Plans
Posted by nnlmneo on September 16th, 2016
Posted in: Blog
What would you rather look at? Some paragraphs of text and bullet points that explain in a step-by-step fashion your process and outcomes evaluation plans, or a diagram of those plans? For me the answer is easy: a diagram. Diagrams have the advantage of being quickly understandable, interesting to look at, invite participation of the viewer, and possibly most important for me, they’re colorful. A textual explanation can walk me through the same process, but I would play a much more passive role, and I might not understand the big picture without having, well, a big picture.
Obviously you would also need the text. Somewhere you need to explain the details of what you’re going to do in your evaluation. But a diagram can make the plan immediately comprehensible, and the reader can then read the textual explanation while understanding the overall context.
Bethany Laursen, an evaluation consultant, posted some examples of what she calls visual evaluation plans in her blog, Laursen Evaluation and Design. These are created by students in a class at the University of Wisconsin-Madison. I like them because by looking at them I have a basic understanding of their projects and how they will be evaluated.
Her blog post presents visual evaluation plans as a way of getting non-evaluators to understand your evaluation plans. But I think they can also be a way that people (whether evaluators or non-evaluators who find themselves writing evaluation plans) could begin to think about how to plan their evaluation strategy to fit their project.
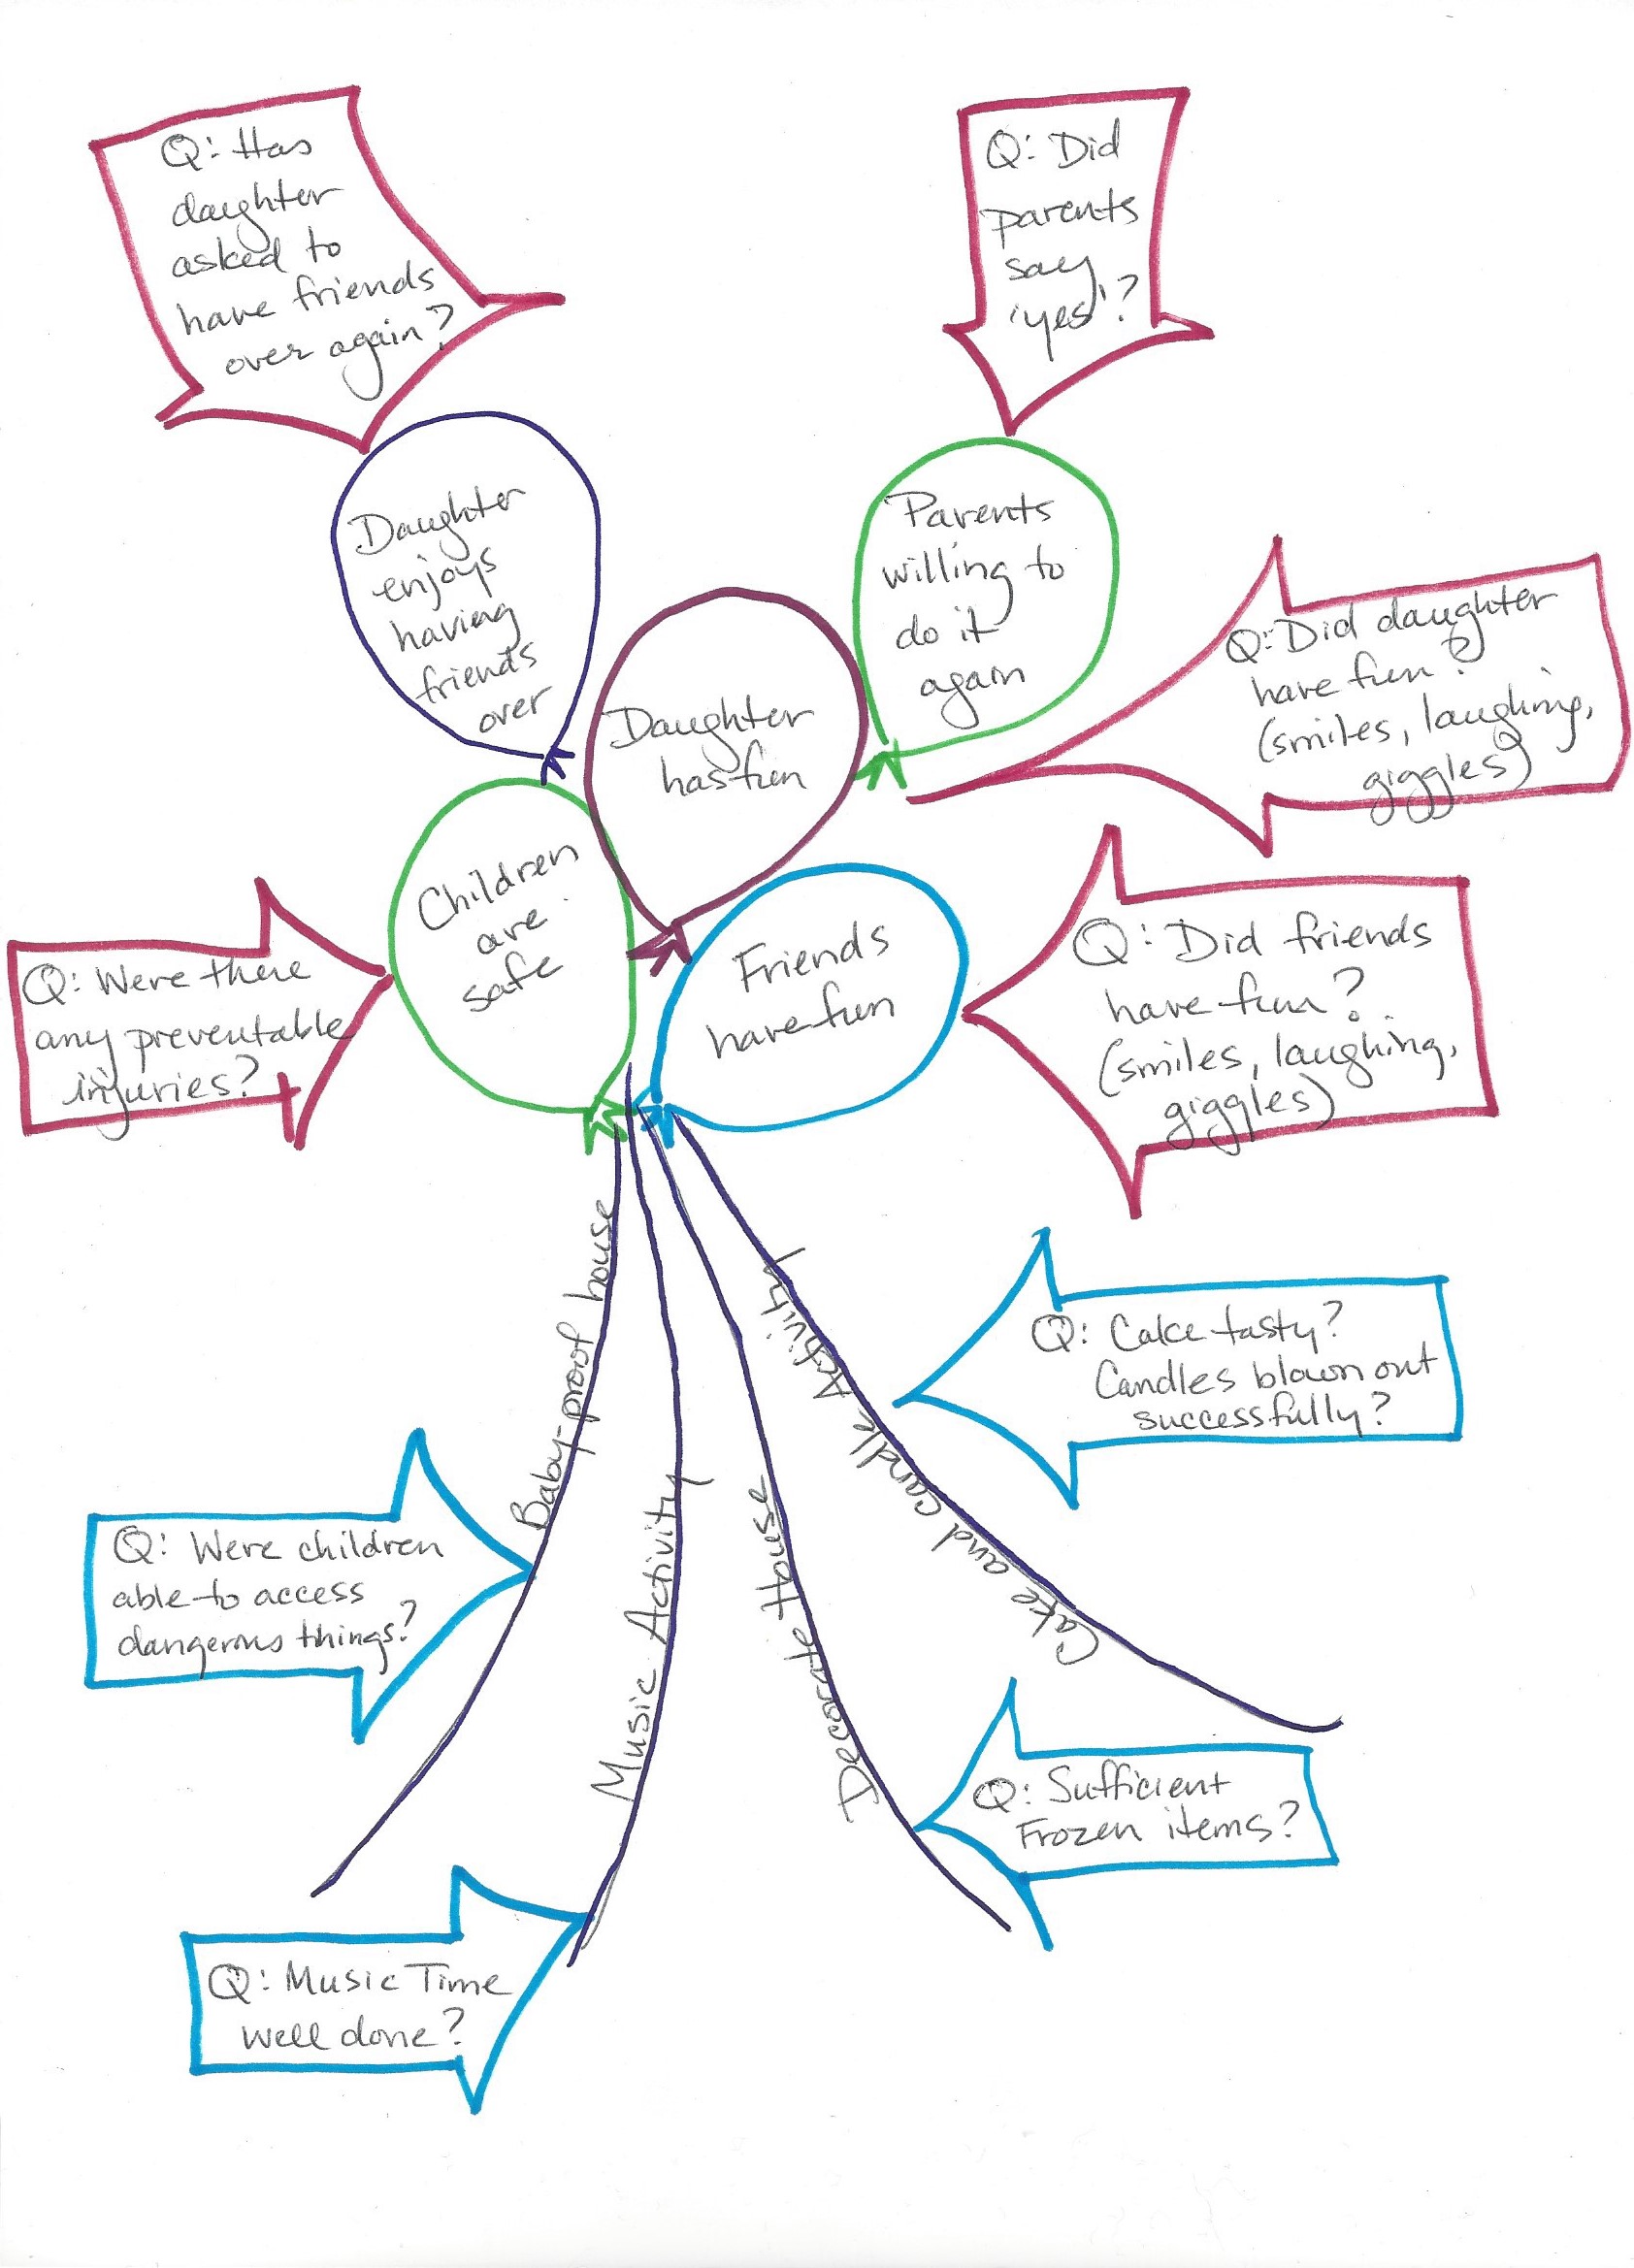
Microsoft products like Word and Power Point have drawing tools that can work to make diagrams. But I think best with pen and paper, so if I were designing an evaluation plan for my daughter’s birthday party (see February 4, 2016 post), I would do something like the drawing here. Then I could create a plan for evaluating each of the process evaluation questions (in blue arrows) and each of the outcome evaluation questions (in red arrows).
This video, Faster Program Evaluation Planning: a New Visual Approach, shows how you could use a product like DoView to create a snazzy looking evaluation plan that also can link images to the textual description of the evaluation, and even further, link to your actual evaluation.
That famous phrase in the title, “a picture is worth a thousand words,” works really well to show how you can use your diagram to communicate your evaluation plan to others. But if you’re using a diagram to design your plan in the first place, the quote that might work better is Gloria Steinem’s: “Without leaps of imagination or dreaming, we lose the excitement of possibilities. Dreaming, after all is a form of planning.”
And as Winnie-the-Pooh says “Nobody can be uncheered with a balloon.”
 ABOUT nnlmneo
Email author
View all posts by nnlmneo
ABOUT nnlmneo
Email author
View all posts by nnlmneo
 Visit us on Facebook