Free Resources to Help Communities Engage with Their Data
Posted by nnlmneo on November 20th, 2017
Posted in: Blog, Data Analysis, Data Visualization
As you already know, the whole NEO team attended the Evaluation 2017 conference last week. I learned enough to fill up quite a few blog posts. Today’s is about some free tools I found out about that can help communities get comfortable working with data.
I went to a presentation by the Engagement Lab at Emerson College. The purpose of this Lab is to re-imagine civic engagement in our digital culture. Engagement Lab has created a suite of free online tools to encourage the communities that they work with data even if they are beginners. The products have super fun examples on each page so you can see if they would work for you.
The one I thought might be best for the NEO (and for this blog) is the one called WTFcsv which stands for what you probably think it stands for (there’s an introductory video that includes a lot of bleeping). The idea is that if you are new at using data and have a ton of data in a CSV file, what the bleep do you do with it?
The web tool has some examples you can look at to understand how the tool works. I like the “UFO Sitings in Massachusetts” example that shows among other things the most common reported shapes/descriptions of UFO sitings in MA (“light” is the most common, followed by “circle”). It even comes with an activity guide for educators to help people learn to work with data.
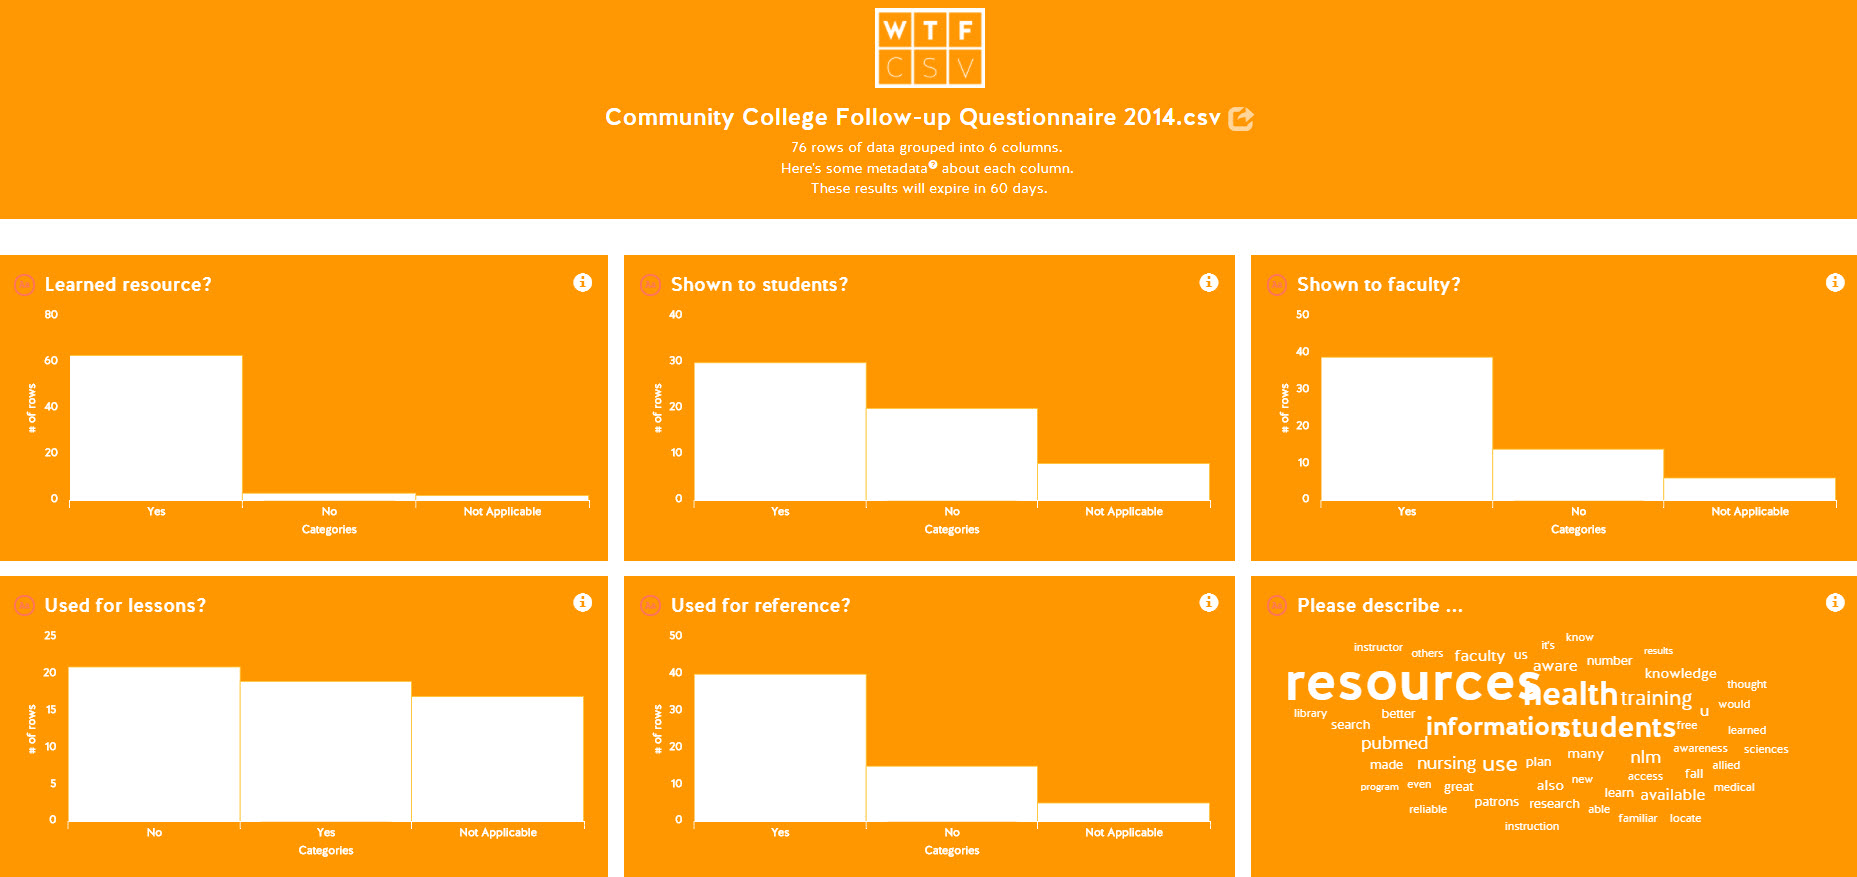
I wanted to see how this would work with National Network of Libraries of Medicine data. A few years ago NNLM had an initiative to increase awareness and use of National Library of Medicine resources, like PubMed and MedlinePlus, among community college librarians. I uploaded the CSV file that had the results of that project. This image is a screen shot of the results (you can click on it to make it bigger). I think it did a good job of making charts that would give us something to talk about.
The good news is that it only takes minutes to upload the data and see the results. Also, below the data is a paragraph with some suggestions of conversations you might want to have about the data. WTFcsv is a tool for increasing community interaction with data, so this is very helpful. The results stay up on the website for 60 days, so you can share the link with a group.
Most of the bad news has to do with trying to make an example that would look good in this blog. In order to find data that would make a nice set of images to show you, I went through a lot of our NNLM NEO data. And I did have to reformat the data in the CSV file for it to work nicely. But if you were using the tool as a starting point, it’s okay for the data to not quite work with the WTFcsv resource – the purpose is to give you something to talk about, and it certainly does that (even if the something is that you might need to reconfigure your data a little).
The titles of each chart only allowed very few characters. So I had to shorten the titles of the data’s columns down to what may only partly represent the data. However, I was making something to show in a screenshot, which is not what this tool is designed for. If I had left the titles long, they would show up when you click on the chart and get some of the additional information.
The presenter showed us three additional tools from the Emerson College Engagement Lab made that are available for anyone to use for free.
Wordcounter tells you the most common words in a bunch of text, including bigrams (pairs of words) and trigrams (sets of 3 words together). This can be a starting point for textual analysis.
Same Diff compares two or more text files and tells you how similar or different they are. Examples include comparing the speeches of Hillary Clinton and Donald Trump, or comparing the lyrics of Bob Dylan and Katy Perry, among others.
Connectthedots shows how your data are connected by analyzing them as a network. They show a chart where each node is a character in Les Misérables, and each link indicates that they appear in a scene together.
If you want to know more about applying these tools in a real life situation, the Executive Director of the Engagement Lab, Eric Gordon, has an online book called Accelerating Public Engagement: A Roadmap for Local Government.
 ABOUT nnlmneo
Email author
View all posts by nnlmneo
ABOUT nnlmneo
Email author
View all posts by nnlmneo
 Visit us on Facebook